Automobiles can be a fascinating subject matter. But instead of reading another article, how about checking out an infographic instead? Infographics are a quick, bite-sized way to learn something new. The best infographics bring together good data and graphics to tell a story. If you’re always on the lookout for fun facts about cars, but you’re short on time, check out these awesome automobile infographics on the web.
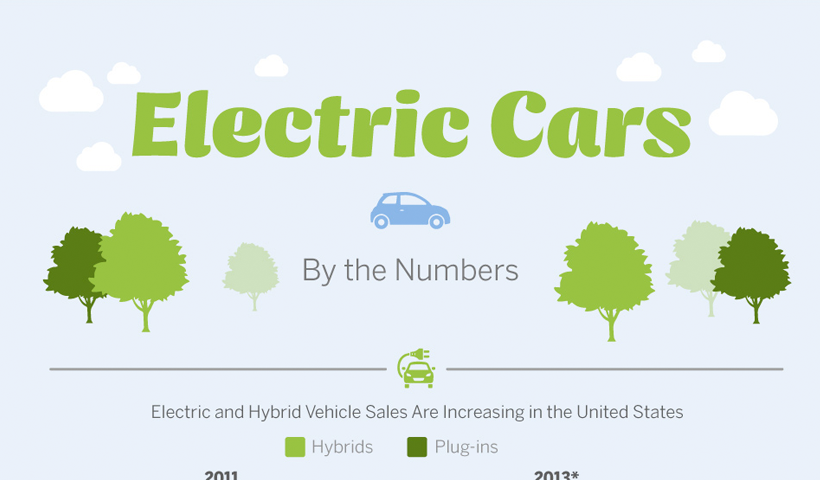
In this infographic, Statista illustrates some important data regarding electric and hybrid car use. The graphic highlights the features offered by different electric car manufacturers including annual fuel cost, charge time, and mileage range.
It also shows how electric and hybrid car sales are on the rise in both the US and the UK. In the UK, sales of hybrid vehicles went from a modest 854 vehicles in 2002 to 125,270 vehicles in 2012. In the US, hybrid car sales rose from 266,329 in 2011 to 424,290 in 2013.
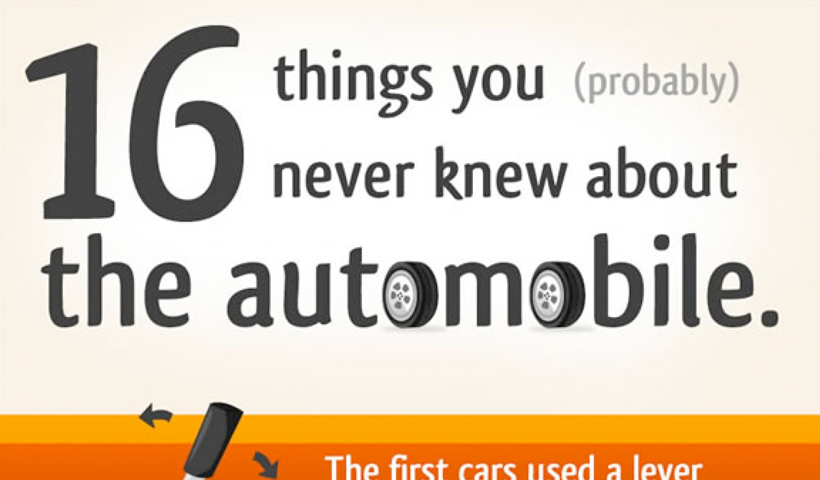
16 Things You Never Knew About The Automobile
This fun infographic from The Car Connection presents some interesting, but little-known facts about cars. Ever wonder how much gas it takes to start your car? How long would it take to drive to the moon? Do you know in which country it’s illegal to slam your car door? How long can you really drive your car after you hit the dreaded “empty”? Learn all the answers to these burning questions and more.
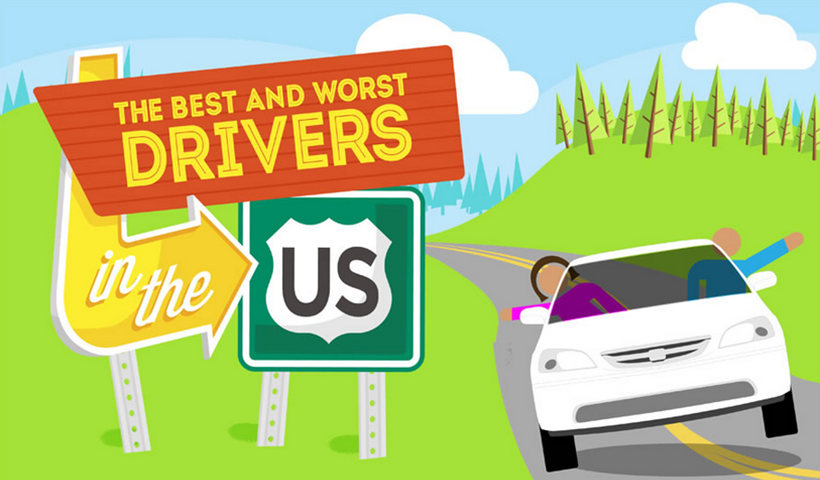
The Best and Worst Drivers in the US
Although everyone has an opinion on bad drivers, not many people know the facts. Good2Go Auto Insurance created an infogaphic which gives an overview of the best and worst drivers in America. That’s right. Now you can know who is really the worst driver based on state, city, and even gender.
You may be interested to learn that the best drivers hail from Sioux City, South Dakota and the worst drivers are residents of Washington D.C. Also, male drivers are cited more than female drivers for reckless driving, seat belt violations, and speeding.
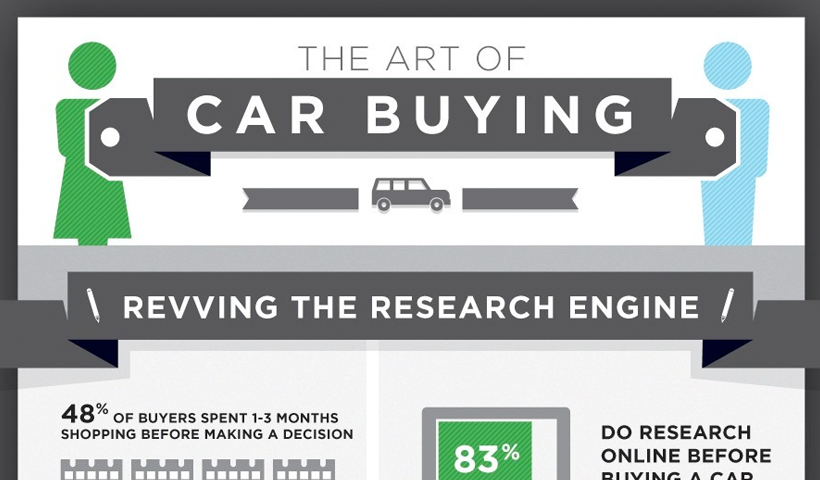
The Art of Car Buying
If you’re thinking of buying a car, you may want to check out this infographic from Lab42 first. It shows purchase behaviors, buyer frustrations, manufacturer loyalty, and other miscellaneous car-buying tidbits. Unsurprisingly, most consumers (83% of those surveyed) go online to research their car purchase before they buy a car. But did you know that more than half of consumers are considering buying a hybrid for their next car purchase? If you’re getting ready to buy a car, you’ll be glad you checked out how to execute the art of car buying.
Shocking Effects of the Google Driverless Car
The idea of a driverless car has been around for quite awhile, but Google’s self-driving car has actually made this idea into a reality. Aptus Insurance put together an infographic that breaks down the effects of driverless cars. On the plus side, self-driving cars could save the lives of 10,000 people annually who would have been killed by drunk drivers. Since 93% of all automobile crashes are caused by human factors, self-driving cars could vastly reduce the amount of auto accidents. On the downside, driverless cars could cause a loss of state revenue (license fees) and unemployment for taxi drivers and chauffeurs.
How a Car Engine Works
Ever wondered exactly what’s going on under the hood? Most of us are more concerned about how much engine repairs will cost than how things work. This infographic from Animagraffs shows you how your car’s engine works, plus some other fun engine facts. This graphic can help you learn all the engine parts as well as different types of engine configurations and systems. It also explains the basic differences between hybrid and traditional engines.
Auto Safety Infographic: Evolution of Auto Safety
Auto safety has come a long way since the days of airbags and seat belts. The folks at Atlantic Training published an infographic outlining the history of auto safety in the United States. From developments in safety glass to driver’s ed, this graphic covers car safety from 1901 to present day. The infographic also describes cutting-edge safety technology such as collision warnings and adaptive headlights.
You can learn a lot from infographics! Did you learn something new? Tell us which infographics are your favorites.